Azure Course Labs
Log Analytics
Log Analytics is the data store for all sorts of log collection in Azure. Application Insights sends data to Log Analytics, and it can also be used directly for Virtual Machines, and to ingest logs saved in Storage Accounts.
The Azure Portal has a rich UI in Log Analytics for querying data, using Kusto Query Language (KQL). You can use KQL with Log Analytics data for other monitoring tools (to power dashboards and alerts), and you use Log Analytics to write and test the queries for them - as well as for interactive querying.
In this lab we’ll see how Log Analytics gives access to data collected by Application Insights, and get some experience with KQL.
Reference
Generate some log data
If you have done the Application Insights lab and still have your labs-appinsights Resource Group with App Insights and Log Analytics then you can skip this step.
Create the Log Analytics Workspace and run some containers to generate logs</summary>
Create one RG for monitoring, with Workspace and App Insights:
az group create -n labs-appinsights -l eastus --tags courselabs=azure

az monitor log-analytics workspace create -g labs-appinsights -n labsloganalytics -l eastus

az monitor app-insights component create --app labs --kind web -g labs-appinsights --workspace labsloganalytics -l eastus
Get the connection string for App Insights:
az monitor app-insights component show --app labs -g labs-appinsights --query connectionString -o tsv
Create another RG for sample apps, with ACI containers writing to App Insights:
az group create -n labs-appinsights-apps --tags courselabs=azure -l eastus

az container create -g labs-appinsights-apps  --image courselabs/fulfilment-processor:appinsights-1.0 --no-wait --name fp1 --secure-environment-variables "ApplicationInsights__ConnectionString=<appinsights-connection-string>"

az container create -g labs-appinsights-apps  --image courselabs/fulfilment-processor:appinsights-1.0 --no-wait --name fp2 --secure-environment-variables "ApplicationInsights__ConnectionString=<appinsights-connection-string>"

az container create -g labs-appinsights-apps  --image courselabs/fulfilment-processor:appinsights-1.0 --no-wait --name fp3 --secure-environment-variables "ApplicationInsights__ConnectionString=<appinsights-connection-string>"

az container create -g labs-appinsights-apps  --image courselabs/fulfilment-processor:appinsights-1.2 --no-wait --name fp4 --secure-environment-variables "ApplicationInsights__ConnectionString=<appinsights-connection-string>"
</details>
The ACI containers generate a lot of logs and metrics, so you should have plenty of data to work with.
Query Application Logs
Open your Log Analytics Workspace in the Portal, and browse to the Logs view. You’ll see a pop-up with lots of sample queries, none of which are any use here so you can close that window.
Now you’re in the KQL query editor. The left menu has a list of sample queries which are also no use here, so switch to the Tables view:
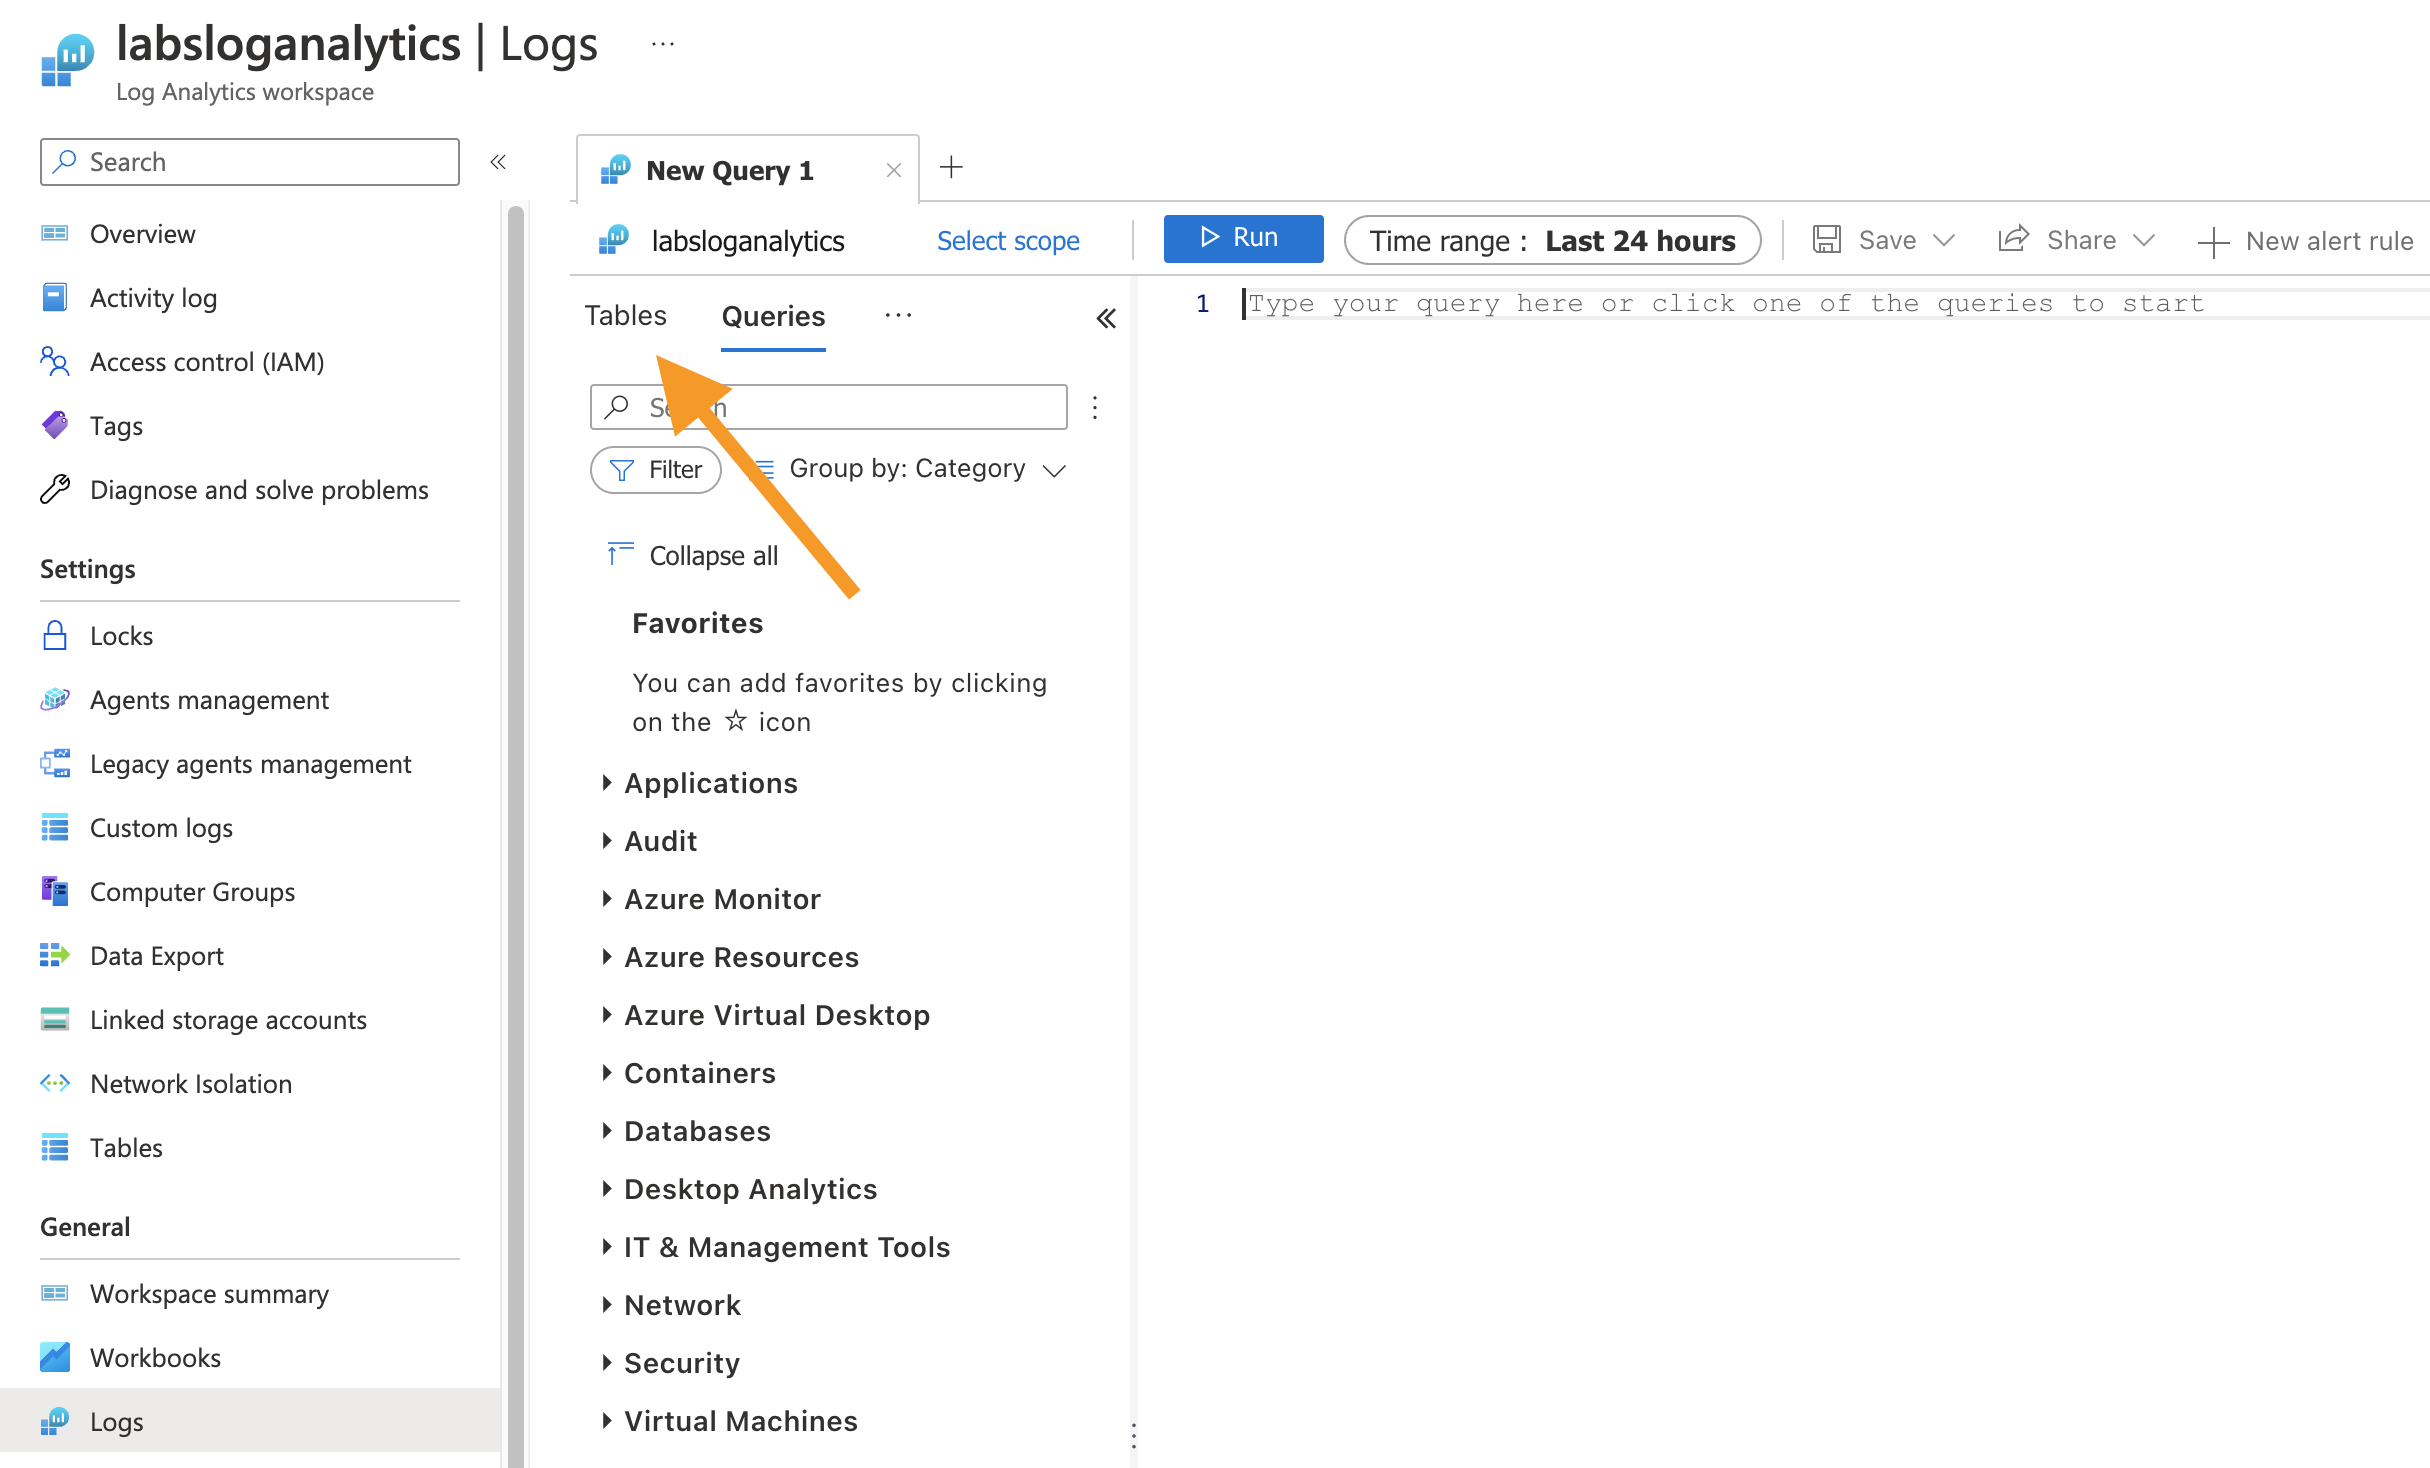
These are the actual data tables in the Workspace. Expand LogManagement and you’ll see lots of tables which are populated from Application Insights.
The simplest KQL query is just the table name. Try selecting data from these tables:
- AppEvents
- AppDependencies
- AppTraces
This is the same data you see surfaced in different views in Application Insights. AppTraces contains the actual log entries written by the application.
Explore some more KQL queries - it’s similar to SQL but it has many more functions and a stricter syntax. Individual queries can’t have a line break in them, and clauses are separated with a pipe (|):
AppTraces
| limit 100

AppMetrics
| order by TimeGenerated desc
| limit 10

AppTraces
| distinct SeverityLevel

AppTraces
| summarize LogsBySeverity = count() by(SeverityLevel)
What are we seeing here? The first 100 log entries; the 10 most recent log entries; the list of log severities across all logs; a breakdown showing the count for each log severity. Do you have any severity 3 logs?
📋 Write a KQL to find the individual log entries for a specific severity level - print just the message, application name and instance name for each entry.
📋 How many logs of severity 3 have the error code 302?
📋 Can you see if one application instance is recording more Fulfilment.Failed events than the others?
Aggregating Application Metrics
Everything from App Insights is recorded as a row in a table, which means you use the same query language to drill into individual log entries and to summarize metrics.
The AppMetrics table stores custom metrics get reported by applications. Try these queries:
AppMetrics
| count

AppMetrics
| limit 10

AppMetrics
| where (Name == "QueueSize")
| summarize AvgQueueLength = avg(Sum)
What was all that? The count of all recorded metrics; the first 10 rows of metrics; the average of the QueueSize metric.
That average isn’t much use because it’s the average over all time. More useful would be a breakdown of the average queue length over time, so we can see if it’s trending up or down and if there are outliers.
📋 What does the average queue size look like if you summarize it by 10 minute intervals?
📋 Can you render that table with a more useful visualization?
Lab
Visualizations in Log Analytics are good for quick queries, but if you want a more useful view of application health and performance you need to create a Workbook. The Workbook UX in Azure takes some getting used to, but the visualizations are powered by KQL queries over a Log Analytics Workspace.
Build a Workbook for the Fulfilment Processor app which shows:
- a table of all the instances which are currently running
- a breakdown of the
Fulfilment.Failed events, split by instance
- a graph of
QueueSize, averaged across 10-minute intervals
Cleanup
Delete the RG(s) and all the data will be deleted too:
az group delete -y --no-wait -n labs-appinsights-apps

az group delete -y --no-wait -n labs-appinsights
az group create -n labs-appinsights -l eastus --tags courselabs=azure
az monitor log-analytics workspace create -g labs-appinsights -n labsloganalytics -l eastus
az monitor app-insights component create --app labs --kind web -g labs-appinsights --workspace labsloganalytics -l eastus
az monitor app-insights component show --app labs -g labs-appinsights --query connectionString -o tsv
az group create -n labs-appinsights-apps --tags courselabs=azure -l eastus
az container create -g labs-appinsights-apps --image courselabs/fulfilment-processor:appinsights-1.0 --no-wait --name fp1 --secure-environment-variables "ApplicationInsights__ConnectionString=<appinsights-connection-string>"
az container create -g labs-appinsights-apps --image courselabs/fulfilment-processor:appinsights-1.0 --no-wait --name fp2 --secure-environment-variables "ApplicationInsights__ConnectionString=<appinsights-connection-string>"
az container create -g labs-appinsights-apps --image courselabs/fulfilment-processor:appinsights-1.0 --no-wait --name fp3 --secure-environment-variables "ApplicationInsights__ConnectionString=<appinsights-connection-string>"
az container create -g labs-appinsights-apps --image courselabs/fulfilment-processor:appinsights-1.2 --no-wait --name fp4 --secure-environment-variables "ApplicationInsights__ConnectionString=<appinsights-connection-string>"
AppTraces contains the actual log entries written by the application.|):AppTraces
| limit 100
AppMetrics
| order by TimeGenerated desc
| limit 10
AppTraces
| distinct SeverityLevel
AppTraces
| summarize LogsBySeverity = count() by(SeverityLevel)
Fulfilment.Failed events than the others?AppMetrics table stores custom metrics get reported by applications. Try these queries:AppMetrics
| count
AppMetrics
| limit 10
AppMetrics
| where (Name == "QueueSize")
| summarize AvgQueueLength = avg(Sum)
QueueSize metric.Fulfilment.Failed events, split by instanceQueueSize, averaged across 10-minute intervalsaz group delete -y --no-wait -n labs-appinsights-apps
az group delete -y --no-wait -n labs-appinsights